

Table of Contents
The most expensive domestic flight routes in America are not the long ones. They are the short hops into ski towns, and the federal fare data shows it every winter.
In the first quarter of 2026, passengers flying between Atlanta and Aspen, Colorado, paid an average of $648 each way. That was the highest average fare of the 6,313 city pairs in the 48 contiguous states that the Department of Transportation tracked at 10 or more passengers a day, for a trip of just 1,304 miles (2,098 km).
New York to San Francisco, the coast-to-coast flight most people would guess, is twice as far and averaged $518. Among the 1,000 busiest routes, four of the five most expensive ended in a ski town.
Why a Ski Town Costs More Than a Cross-Country Flight
Distance is only one input to a fare. The others are how many seats exist, how many airlines compete for them, and how badly the people buying them want to go.
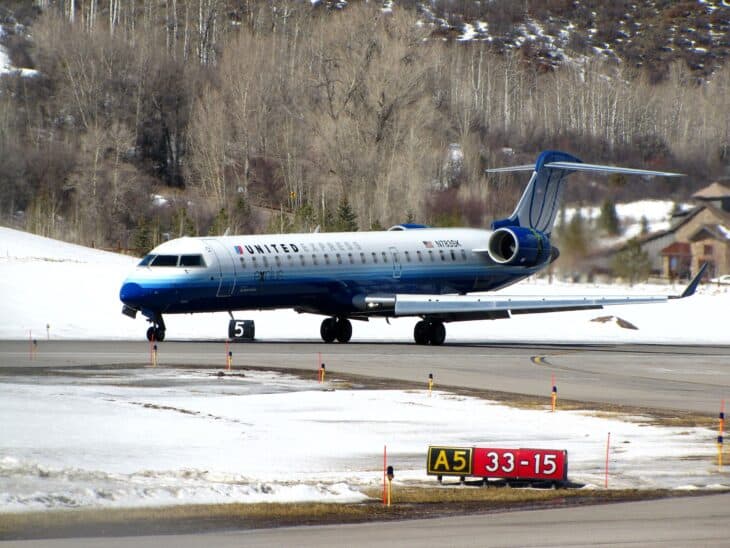
Mountain resorts score badly on all three. The Aspen-Pitkin County Airport is certified only for aircraft with a wingspan of up to 95 feet (29 m), because its taxiway sits too close to the runway for anything larger.
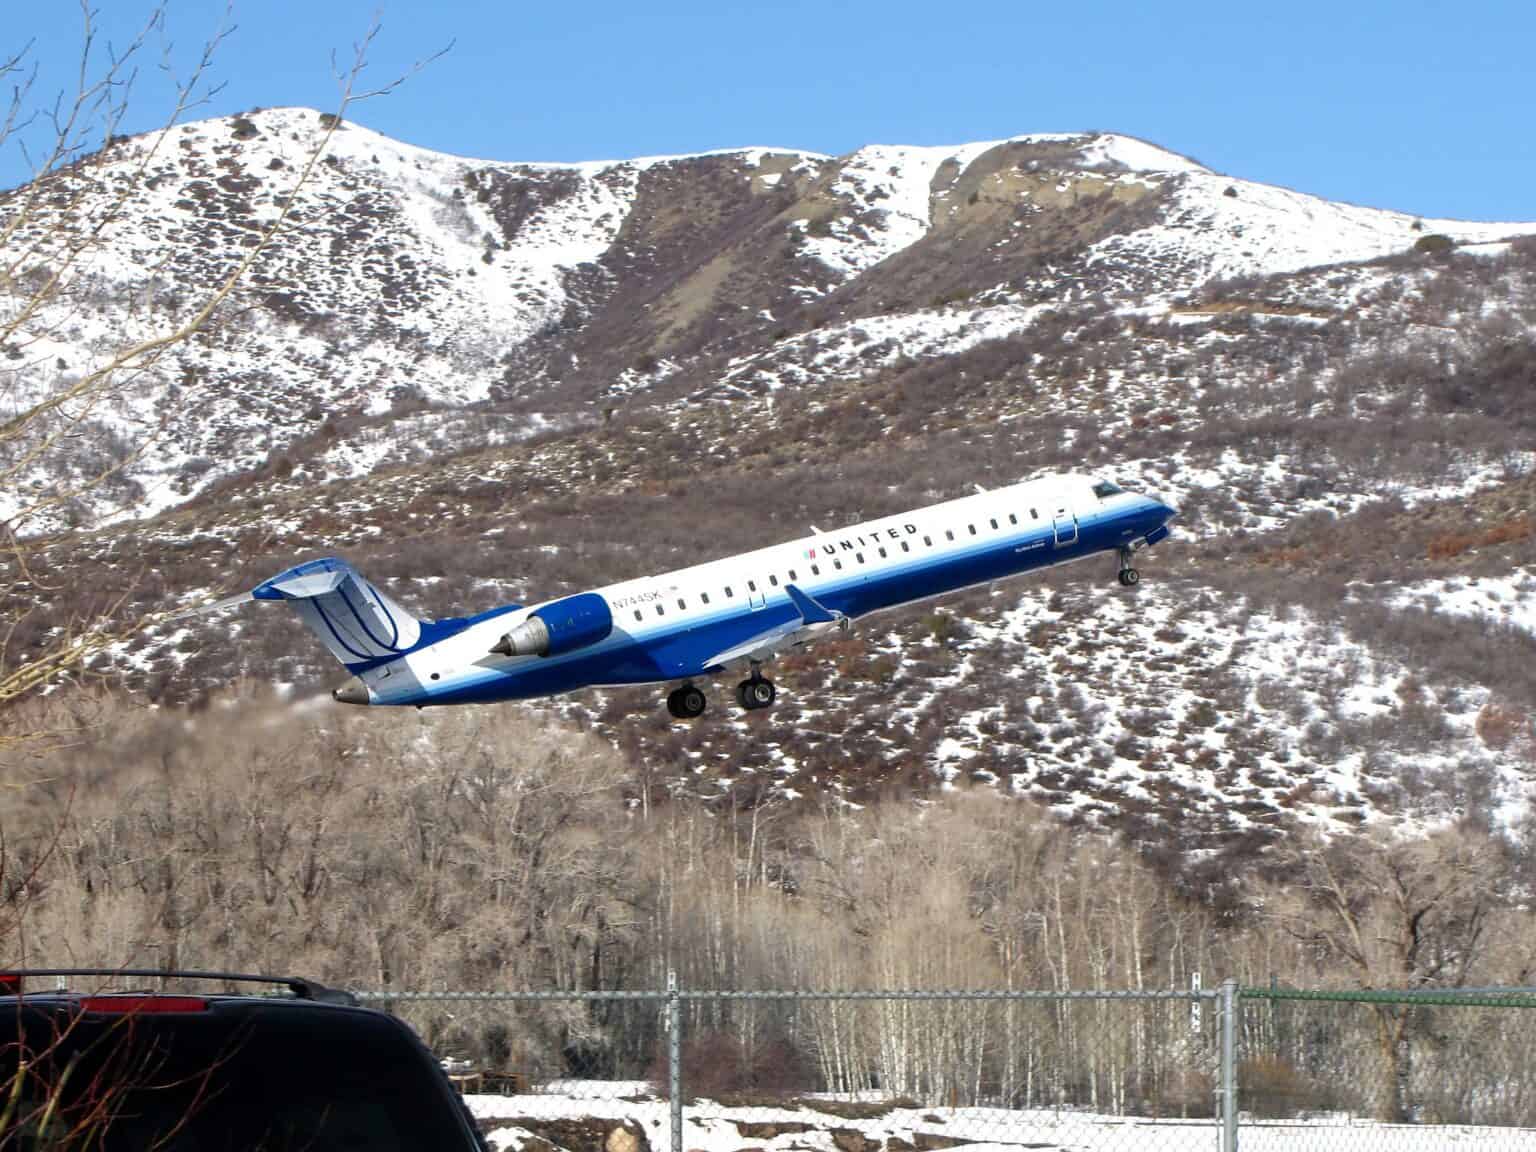
That limit has kept Aspen a regional-jet airport. The workhorse there has been the 70-seat Bombardier CRJ700, with a wingspan of 76 feet 3 inches, and SkyWest’s Aspen Embraer 175s also seat 70, 12 of them in first class.

Few seats meet affluent, seasonal demand, and usually one airline controls most of them. Delta carried 91% of the Atlanta-Aspen passengers in the quarter, and United carried 81% between New York and Jackson, Wyoming.
The averages also include first-class tickets, taxes and airport fees, though not bag fees or award tickets, according to the DOT’s description of the report. On small jets with a dozen premium seats sold to ski travelers, that pulls the average up.
The 10 Most Expensive of America’s 1,000 Busiest Routes
The DOT’s Domestic Airfare Consumer Report ranks the 1,000 largest city-pair markets each quarter. A city pair counts every passenger between two metro areas, nonstop or connecting, so “New York” covers JFK, LaGuardia and Newark together.
Here are the 10 highest average fares in that table for January through March 2026, the latest quarter the DOT has published.
| Rank | City pair | Average fare (each way) | Distance | Passengers per day | Largest airline (share) |
|---|---|---|---|---|---|
| 1 | Eagle/Vail, CO to Miami | $576 | 1,810 mi (2,913 km) | 231 | American (80%) |
| 2 | Aspen, CO to New York | $570 | 1,750 mi (2,816 km) | 236 | United (65%) |
| 3 | Jackson, WY to New York | $565 | 1,894 mi (3,048 km) | 296 | United (81%) |
| 4 | Eagle/Vail, CO to New York | $528 | 1,746 mi (2,810 km) | 412 | United (56%) |
| 5 | New York to San Francisco | $518 | 2,619 mi (4,215 km) | 7,028 | United (37%) |
| 6 | Atlanta to Salt Lake City | $506 | 1,590 mi (2,559 km) | 706 | Delta (79%) |
| 7 | Detroit to Salt Lake City | $474 | 1,481 mi (2,383 km) | 300 | Delta (84%) |
| 8 | Los Angeles to New York | $454 | 2,510 mi (4,039 km) | 10,752 | United (31%) |
| 9 | New York to Palm Springs, CA | $451 | 2,413 mi (3,883 km) | 518 | Alaska (45%) |
| 10 | Atlanta to Sacramento | $444 | 2,092 mi (3,367 km) | 294 | Delta (67%) |
The distance column breaks the obvious assumption. Eagle-Miami, the most expensive busy route, is shorter than 140 of the other 999 markets in the same table.
The longest market on the list, Miami to Seattle at 2,724 miles (4,384 km), averaged $331 and ranked 169th by fare. Per mile, Eagle-Miami cost about 32 cents, Miami-Seattle about 12 cents and Atlanta-Aspen almost 50 cents.
Volume tells the rest. New York-San Francisco moved about 7,028 passengers a day each way, roughly 30 times the Eagle-Miami traffic, and it still made the top five.
The two Salt Lake City routes fit the same pattern from a different angle: Atlanta, Detroit and Salt Lake City are all Delta hubs, and Delta held 79% and 84% of those markets. Across all 1,000 markets, the passenger-weighted average was about $259 each way, by AeroCorner’s calculation from the same table.
The cheapest busy routes
At the other end of the same Q1 2026 table, Knoxville to Sanford, Florida, and Phoenix to Provo, Utah, both averaged about $94 each way. Both are routes of around 500 miles (800 km) where Allegiant carried most of the passengers.
The Priciest Route Moves With the Seasons
The ski routes are a winter phenomenon. Of the last five quarters published, Eagle-Miami made the 1,000-busiest table only in the first quarter of 2025 and 2026, when it averaged $526 and then $576.
Outside ski season, the transcontinental route usually takes over. New York-San Francisco led the busiest-1,000 table in the second quarter of 2025 at $452 and in the fourth quarter at $516, ahead of Los Angeles-New York at $464.
Usually, not always. Jackson-New York topped the table in the summer quarter of 2025 at $489, and in the first quarter of 2025 the top three were all ski towns, led by Aspen-New York at $642.
Summer brings its own outliers in the wider table. In the third quarter of 2025, the highest average fare among all tracked markets was Nantucket to Teterboro, New Jersey, at $818 each way for a flight of 211 miles (340 km).
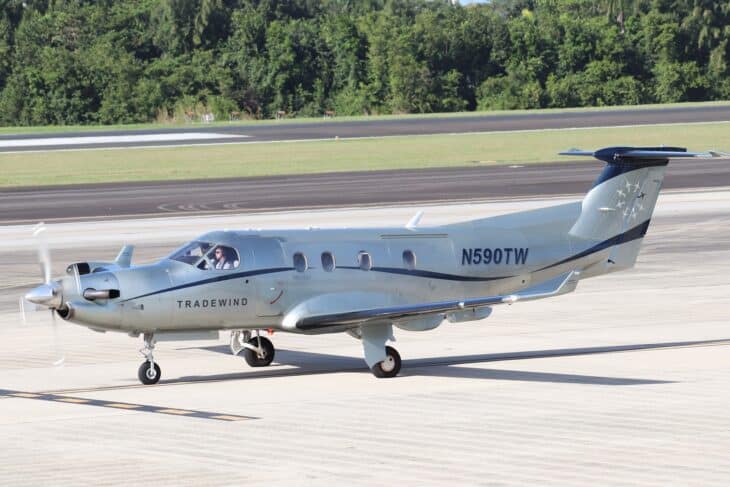
The DOT data credits that market entirely to the carrier code TJ, which is Tradewind Aviation, the largest operator of the Pilatus PC-12 single-engine turboprop in scheduled airline service. Martha’s Vineyard to Teterboro, 184 miles (296 km), came second at $762.
For a traveler, the lesson is that a fare prices scarcity, not miles. That is a different question from why flying as a whole got so expensive this year, which is about fuel and capacity across the whole system.
The DOT figures are each-way averages. If you are pricing a ski trip, check both directions separately, because the round-trip discount has largely disappeared on US airlines.
Aspen’s Runway Closes in 2027, and the Next Report Is Due
The DOT says carriers submit the underlying ticket data about five or six months after each quarter ends. The April to June 2026 quarter is the next one due.
Aspen itself is about to change. The airport will close to all commercial and private flights from 11 p.m. on April 4, 2027 until 7 p.m. on Nov. 19, 2027, while the runway is rebuilt, shifted slightly west and widened from 100 feet to 150 feet (30 m to 46 m), One Mile at a Time reported.
For those seven and a half months, Aspen will have no airline service at all. Travelers will need another airport, such as Eagle/Vail, which already tops the busiest-routes table.
Whether a rebuilt runway brings bigger jets, more seats and lower fares is a separate question the airport has not yet answered. Until then, the route at the top of the Lower 48’s fare table ends on a 70-seat jet.
Sources and references used for research and fact-checking.
- U.S. Department of Transportation, Consumer Airfare Report: Table 1, Top 1,000 Contiguous State City-Pair Markets
- U.S. Department of Transportation, Consumer Airfare Report: Table 6, Contiguous State City-Pair Markets That Average At Least 10 Passengers Per Day
- U.S. Department of Transportation, Domestic Airfare Consumer Report
- U.S. Department of Transportation, Domestic Airfare Consumer Report details
- Aspen Public Radio, First E-175 flight lands in Aspen today
- One Mile at a Time, The Debate Over Aspen Airport's Future
- One Mile at a Time, Aspen Airport (ASE) Closing For Most Of 2027, For Runway Redevelopment
- Wikipedia, Tradewind Aviation
- Wikipedia, Delta Air Lines
Get the Newsletter
The latest aviation news and stories sent to your inbox.
About the Author

Tim is the owner and lead editor of AeroCorner since 2019, overseeing aviation content covering aircraft, airlines, airports, and the broader aviation industry. Through years of researching, writing, editing, and publishing aviation-focused content, he has developed extensive practical knowledge of commercial aviation and air travel. Based in Asia and a frequent traveler himself, Tim also brings firsthand passenger experience to AeroCorner’s coverage. Outside of publishing, he has also explored aviation firsthand through hands-on flight training in New Zealand.