

Table of Contents
A year earlier, SFO sat in the middle of the pack. A six-month runway closure and an FAA ban on its famous side-by-side landings sent it to the bottom.
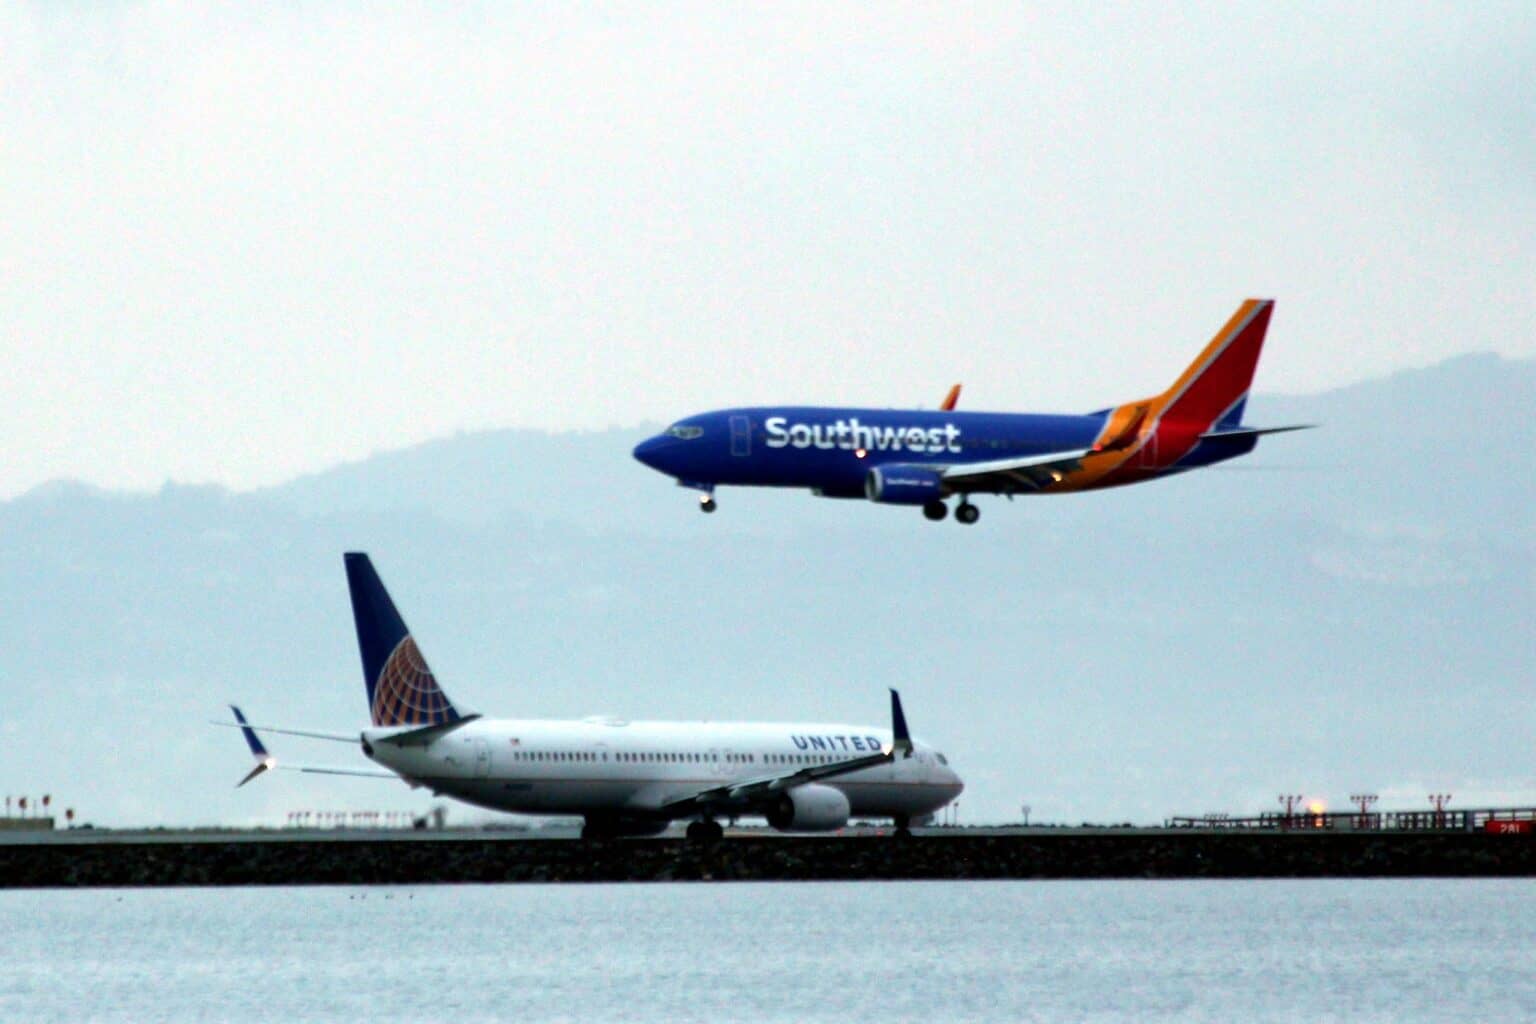
The most delayed big airport in the United States in 2026 is San Francisco International (SFO). From January through August 2026, only 61.8% of the 100,072 domestic flights scheduled to land there arrived on time, the lowest rate of the 30 major airports the Department of Transportation tracks.
That means 38.2% of arrivals, more than 38,000 flights, landed 15 minutes or more late, were canceled or were diverted. Salt Lake City was the best of the 30 at 83.0%, and the rate across every US airport in the data was 74.5%.
How we counted
These figures are AeroCorner’s own count from the Bureau of Transportation Statistics flight-level on-time files for January to August 2026, the latest month published when we checked on Nov. 7, 2026. They cover domestic flights by the US airlines that report to the DOT. A flight is on time if it arrived less than 15 minutes after schedule; canceled and diverted flights count as late. The DOT’s own monthly tables can differ from ours by a few tenths of a point.
Why San Francisco Lost a Third of Its Landing Capacity in Two Days
SFO’s trouble started on March 30, 2026, when the airport closed its north-south runways for about six months: 1R for repaving, taxiway work, lighting and markings, and 1L to serve as a taxiway. Every arrival and departure moved onto the two east-west runways, 28 Left and 28 Right.
The next day the FAA added a second blow. It ended SFO’s long-standing practice of landing two planes side by side in clear weather on parallel runways only 750 feet (229 m) apart, saying the practice, combined with congested airspace, was too dangerous.
Together the two changes cut SFO’s maximum arrival rate from 54 flights an hour to 36, according to the AP. The runway work accounted for nine of the 18 lost landings an hour and the FAA rule for the other nine.
A former SFO communications manager described the result to KTVU as “a single-lane highway with a merge point.” Airport spokesman Doug Yakel said at the time that about 25% of arriving flights were expected to be delayed by 30 minutes or more.
That forecast was too kind. From April through August, 32.1% of the flights that landed at SFO arrived 30 minutes or more late, and 15.6% were at least an hour late.
All 30 Major US Airports, Ranked by On-Time Arrivals
The ranking below runs from the most delayed to the most punctual, with the same January to August window in 2025 for comparison. Twenty of the 30 airports got worse, and the all-airport rate slipped from 75.6% to 74.5%.
| Rank | Airport | On time, Jan to Aug 2026 | On time, Jan to Aug 2025 | Change (points) |
|---|---|---|---|---|
| 1 | San Francisco (SFO) | 61.8% | 76.4% | −14.6 |
| 2 | Washington Reagan National (DCA) | 66.2% | 67.2% | −1.0 |
| 3 | New York LaGuardia (LGA) | 67.2% | 72.4% | −5.2 |
| 4 | Fort Lauderdale (FLL) | 67.9% | 74.8% | −6.9 |
| 5 | San Diego (SAN) | 70.4% | 75.6% | −5.2 |
| 6 | Chicago O’Hare (ORD) | 70.4% | 73.9% | −3.5 |
| 7 | Boston Logan (BOS) | 71.2% | 74.7% | −3.5 |
| 8 | New York JFK (JFK) | 71.3% | 74.5% | −3.2 |
| 9 | Orlando (MCO) | 72.1% | 73.5% | −1.4 |
| 10 | Chicago Midway (MDW) | 72.5% | 78.8% | −6.2 |
| 11 | Philadelphia (PHL) | 72.8% | 72.0% | +0.7 |
| 12 | Tampa (TPA) | 73.2% | 73.5% | −0.4 |
| 13 | Dallas/Fort Worth (DFW) | 75.1% | 70.7% | +4.4 |
| 14 | Miami (MIA) | 75.2% | 74.6% | +0.6 |
| 15 | Newark (EWR) | 75.4% | 69.5% | +5.9 |
| 16 | Baltimore/Washington (BWI) | 76.0% | 77.4% | −1.4 |
| 17 | Las Vegas (LAS) | 76.0% | 78.5% | −2.4 |
| 18 | Detroit (DTW) | 76.2% | 79.1% | −2.9 |
| 19 | Denver (DEN) | 77.1% | 73.0% | +4.1 |
| 20 | Honolulu (HNL) | 77.3% | 84.1% | −6.8 |
| 21 | Charlotte (CLT) | 77.9% | 77.1% | +0.9 |
| 22 | Los Angeles (LAX) | 78.0% | 80.8% | −2.8 |
| 23 | Seattle-Tacoma (SEA) | 78.6% | 77.4% | +1.2 |
| 24 | Phoenix Sky Harbor (PHX) | 78.7% | 80.3% | −1.6 |
| 25 | Atlanta (ATL) | 78.8% | 77.9% | +0.9 |
| 26 | Houston Bush (IAH) | 79.0% | 75.8% | +3.2 |
| 27 | Portland (PDX) | 79.7% | 80.0% | −0.2 |
| 28 | Minneapolis-St. Paul (MSP) | 79.8% | 80.4% | −0.6 |
| 29 | Washington Dulles (IAD) | 80.7% | 78.5% | +2.2 |
| 30 | Salt Lake City (SLC) | 83.0% | 83.9% | −0.8 |
No other airport fell as far as SFO’s 14.6 points. The next-biggest drops were Fort Lauderdale (6.9 points), Honolulu (6.8) and Chicago Midway (6.2).
Two familiar names fill the rest of the bottom four. Reagan National ran 66.2% on time and canceled 5.0% of its arrivals, while LaGuardia managed 67.2% and canceled 5.9%, the highest cancellation rate of the 30. Fort Lauderdale rounded out the four at 67.9%.
At the top, Salt Lake City was the only big airport above 81%, and it canceled just 0.8% of arrivals. For more airports, see our worst airports for delays rankings.
Size is not the explanation. Chicago O’Hare handled the most arrivals of the 30, 246,521, and still beat SFO by more than eight points, while Atlanta, the busiest airport in the US, ran 78.8% on time.
SFO Went From an 82% Month to a 48% Month
The monthly numbers show how sharp the break was. SFO landed 82.1% of its flights on time in March 2026, then 59.3% in April, the first full month of the closure, 53.3% in May and 48.3% in June.
June was the only month in which any of the 30 airports landed fewer than half its flights on time. July (51.9%) and August (56.8%) were barely better.
The delay causes airlines report back this up. Half of all late-arrival minutes at SFO from January to August were booked to the National Aviation System, the category that covers air traffic control limits and airport capacity. At Salt Lake City, the same category accounted for just 11.6%, and the largest share, 47.0%, was put down to the airlines themselves.
The pain fell hardest on United, which flew 41,520 of SFO’s arrivals, and on its regional partner SkyWest, which flew another 20,406. SkyWest flies regional jets such as the Embraer 175 as United Express, and those small jets wait in the same arrival queue as the widebodies.
For a traveler, the lesson is that an airport’s ranking can change in a single season. SFO’s 76.4% over the same months of 2025 beat Newark, Dallas/Fort Worth and O’Hare, and one construction project plus one FAA ruling took it to last.
Your airline’s record is a separate number, covered in our ranking of the most on-time US airlines.
Where SFO Stands Heading Into the Holidays
Relief at SFO came in two steps. On Aug. 12, the FAA brought in a revised procedure for staggered parallel landings, which Yakel said would “not fully restore” the old arrival rate.
With the repaving due to finish, SFO planned to move most departures back to runways 1L and 1R from Oct. 3. The airport expects about 45 to 48 arrivals an hour in good conditions, still short of the 54 it handled before March, and about 36 in low visibility.
The capacity is not fully back, and an air show was enough to bring the old cap back. During Fleet Week in October, the FAA held SFO-bound flights at their departure airports on two days and capped arrivals at 36 an hour for much of Oct. 9.
Federal on-time data for September onward had not been published when we checked, so whether SFO has climbed off the bottom is still an open question. Portland, which tops our ranking of the best airports in the US built from traveler surveys and awards, landed 79.7% of its flights on time. SFO has spent 2026 as the hardest big airport in America to land at on time.
Sources and references used for research and fact-checking.
- Bureau of Transportation Statistics, Reporting Carrier On-Time Performance (1987 to present), January to August 2025 and 2026
- ABC7 News (Associated Press), SFO faces major delays as FAA reduces arrivals over runway work, safety issues
- KTVU, SFO arrivals could see up to 25% flights delayed due to repaving project, upgrades
- San Francisco Chronicle via AviationPros, Exclusive: SFO Expects Fewer Delays After FAA Partially Reverses Ban on Parallel Landings
- Airways Magazine, SFO 1L/1R departures return, October 2026
- Wikipedia, SkyWest Airlines
Get the Newsletter
The latest aviation news and stories sent to your inbox.
About the Author

Tim is the owner and lead editor of AeroCorner since 2019, overseeing aviation content covering aircraft, airlines, airports, and the broader aviation industry. Through years of researching, writing, editing, and publishing aviation-focused content, he has developed extensive practical knowledge of commercial aviation and air travel. Based in Asia and a frequent traveler himself, Tim also brings firsthand passenger experience to AeroCorner’s coverage. Outside of publishing, he has also explored aviation firsthand through hands-on flight training in New Zealand.