

Most nervous flyers follow the same routine. They merge onto the interstate without a second thought, park, clear security, and only when the engines spool up for takeoff does the knot in the stomach arrive.
The statistics say that knot is in the wrong place. For most travelers, the more dangerous leg of the trip is the one they just drove.
Flying is far safer than driving, but how much safer depends entirely on how you measure it. Per mile the gap is enormous, per hour it shrinks, and per trip it comes down to a distance you can picture. Here is what each measure says, why they disagree, and why the fear sticks to the wrong vehicle.
Is Flying Safer Than Driving?
Yes, on every measure researchers use, and the record behind it is a story of engineering and regulation we cover in why planes are so safe. The newest comparison is a May 2026 report by mathematician Mihhail Berezovski for Embry-Riddle Aeronautical University’s Boeing Center for Aviation and Aerospace Safety.
The center receives some funding from Boeing but says it operates independently. Its report compares US scheduled airlines with other ways of getting around, using data from 2016 onward.
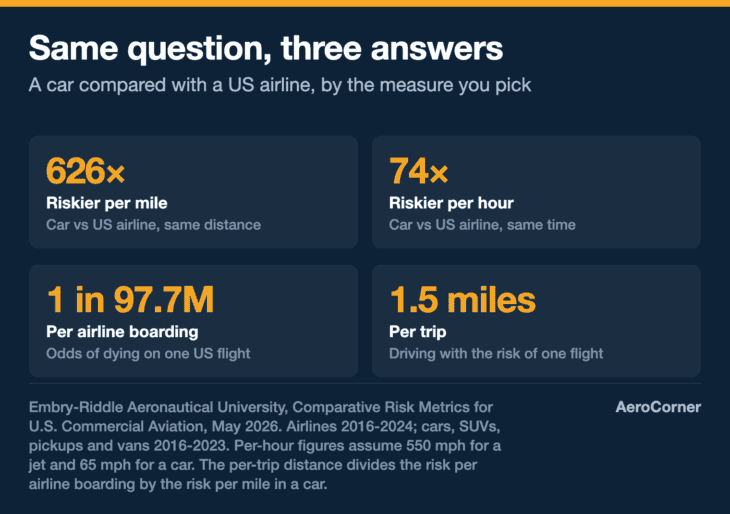
Mile for mile, it puts the fatality risk in a car, SUV, pickup or van at about 626 times that of a US airline. Hour for hour, the car is about 74 times riskier. The chance of dying on any one airline flight works out to roughly 1 in 97.7 million boardings.
These are not small margins hiding in noise. From 2016 through 2025, a decade that includes the January 2025 midair collision near Ronald Reagan Washington National Airport, 73 people died in accidents involving US commercial airline travel, according to the report’s authors.
US roads killed an estimated 36,640 people in 2025 alone, according to NHTSA. That is roughly 100 people a day, in what the agency called a record-low year.
The answer at a glance
Yes. Per mile, a car is about 626 times riskier than a US airline, and per hour about 74 times riskier (Embry-Riddle, 2026). Per trip the gap narrows, because a flight’s risk is concentrated at takeoff and landing: one airline flight carries about the same fatality risk as driving an average mile and a half.
Per Mile, It Is Not a Contest
Distance is the measure most safety statisticians reach for, because it answers the question a traveler actually faces: I need to cover this many miles, so which way is safer? On that basis, the Embry-Riddle figures look like this.
| How you travel | Miles traveled per death | Risk vs. a US airline |
|---|---|---|
| US scheduled airline | 90.9 billion (146.3 billion km) | 1× |
| Highway bus | 10.0 billion (16.2 billion km) | 9× |
| Train | 381 million (613 million km) | 239× |
| Car, SUV, pickup or van | 145 million (234 million km) | 626× |
| Bicycle | 7.6 million (12.2 million km) | 11,998× |
| Motorcycle | 4.1 million (6.6 million km) | 22,279× |
The multiple you see quoted depends on which study and which decade it comes from. Northwestern University’s Ian Savage, using 2000 to 2009 data, found cars and light trucks 112 times riskier per passenger mile than commercial aviation. The National Safety Council’s figures for the most recent ten years put the gap at 1,200 times.
The spread comes from the airline side of the fraction. Airline deaths are so rare that a single crash moves the rate: in Savage’s decade, 446 of the 501 deaths aboard large scheduled airliners came in just four crashes.
The long-run direction never changes, though. MIT’s Arnold Barnett found that the global risk of dying per airline boarding has halved roughly every decade since the late 1960s, from 1 in 350,000 in 1968 to 1977 to 1 in 13.7 million in 2018 to 2022.
That is why older comparisons flatter the car. A ratio built on 2000s data describes an airline system that has since become several times safer.
Per Hour, the Gap Shrinks
Distance flatters the airliner in one obvious way: it is fast. A jet covers in one hour what a car covers in more than eight hours at highway speed, so every mile it flies is exposure squeezed into a sliver of time.
Switch to risk per hour and the multiple drops from 626 to about 74. The report gets there by assuming average speeds of 550 mph (885 km/h) for a jet and 65 mph (105 km/h) for a car, then turning each per-mile rate into a rate per hour.
That car speed is generous, and a slower average would narrow the gap further, because a slower car racks up fewer miles in each hour. Even at half that speed, the report’s own per-mile figure leaves an hour in a car more than 30 times riskier than an hour on an airliner.
Per hour is also the fairest way to set flying beside everything else people do with their time. In the report’s figures, an hour in an airline seat carries about the same risk as an hour on a highway bus, and roughly a third of the risk of an hour at the average American job.
Per Trip, a Flight Equals About a Mile and a Half of Driving
The third measure is the one that matches how people actually experience travel: one trip, one outcome. Here flying’s advantage narrows sharply, for a reason built into the shape of a flight.
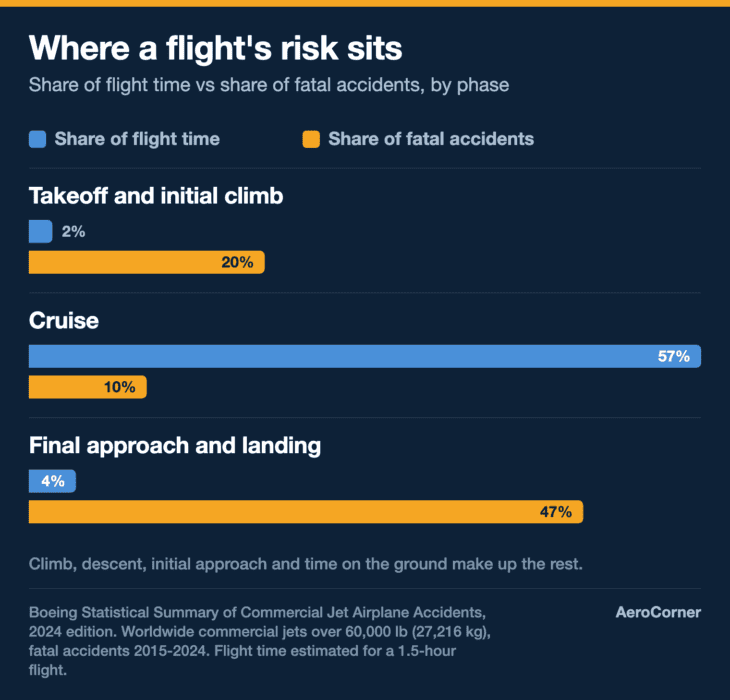
An airliner’s risk is not spread evenly along its route. In Boeing’s accident summary for the worldwide jet fleet, landing takes about 1% of a typical 1.5-hour flight but accounted for 37% of fatal accidents from 2015 to 2024.
Cruise fills 57% of the flight and produced 10%. Takeoff and initial climb, together about 2% of the flight, added another 20%, so a long flight carries only a little more risk than a short one.
A car works the other way, piling up risk with every mile. That lets the Embry-Riddle numbers be set side by side per trip: one US airline boarding carried about a 1 in 97.7 million risk of death, and one mile in a car about 1 in 145 million.
Divide one by the other and an average airline flight carries about the same fatality risk as driving an average mile and a half (2.4 km). For almost anyone who lives more than a couple of miles from the airport, the drive there is the riskier part of the trip.
267,573 years of daily flights
At the Embry-Riddle report’s per-boarding rate, someone who boarded one US airline flight every day would go, on average, 267,573 years before a fatal accident. The same report works out 3,642 years for someone who went skiing every day.
The per-trip view is also where the best-known version of this comparison started. In 2003, University of Michigan researchers Michael Sivak and Michael Flannagan found that driving the length of a typical nonstop flight, 719 miles (1,157 km), was 65 times as risky as flying.
They assumed the drive was on rural interstates, a type of road that is particularly safe per mile. For flying to become as risky as driving, Sivak said, “disastrous airline incidents on the scale of those of Sept. 11 would have to occur about once a month.”
Why It Still Feels the Other Way Around
If the numbers are this lopsided, why does the car feel safe and the plane feel dangerous? The research points to three things: control, the shape of the risk, and the news.
Control comes first. In a small 1981 study, 93% of the University of Oregon students asked rated themselves more skillful than the median driver in their own group, which is statistically impossible. A steering wheel makes risk feel optional, while an airline seat makes it feel imposed.
The shape of the risk matters too. Psychologist Gerd Gigerenzer calls a rare event that kills many people at one time a “dread risk,” and people tend to react to it with avoidance. Road deaths happen in ones and twos, in different places at different times, so nobody sees the total.
Gigerenzer tested the idea on the year after September 11, 2001, when Americans flew less and drove more. He estimated that 1,595 more people died on US roads over the next 12 months than the baseline of previous years predicted, six times the 256 passengers killed on the four hijacked flights.
He stressed that the figure is an estimate, and the story is messier than the headline version. Sivak and Flannagan later counted 1,018 more road deaths than projected in the last three months of 2001, but the biggest share of the increase came on local roads, not the interstates that would replace a flight.
Pedestrians and cyclists also took a disproportionate share of those deaths, which suggests people changed their routines broadly rather than simply swapping planes for cars. Either way, both studies found more deaths on the roads, not fewer.
The Myth vs. the Reality
Myth: the averages do not apply to a careful driver
Driving risk really does vary with age, alcohol, belt use and the type of road, and a sober, belted adult on an interstate can sit below the average. But cut your personal risk to a third of the average and one airline flight still equals only about four and a half miles of your driving.
Savage makes the same point in his study: unlike airline passengers, drivers do not all share one risk. Air travelers skew toward older business travelers who drive larger vehicles on interstates, at times of day with fewer impaired drivers, and all of that makes the car look less bad.
None of it comes close to closing a gap of 74 to 626 times. And even the most careful driver shares the road with everyone else.
The other half of the myth is the word “flying.” The airline figures describe scheduled airliners, not light aircraft: in Savage’s 2000 to 2009 data, private flying killed an average of 549 people a year in the US, against 50 aboard large scheduled airliners.
That pattern has held, and it is why most plane crash deaths in America happen outside the airlines. When the comparison says flying is safer than driving, it means a seat on an airliner, not a friend’s four-seater.
So the next time the engines spool up and your hand finds the armrest, remember where the real exposure of the day was: the merge onto the interstate, the phone buzzing at a red light, the last few miles in the dark.
Buckle up in the taxi to the airport. Statistically, that is the part of the trip that deserves the nerves.
Sources and references used for research and fact-checking.
- Embry-Riddle Aeronautical University, Boeing Center for Aviation and Aerospace Safety, Comparative Risk Metrics for U.S. Commercial Aviation (Part 121)
- The Conversation, Compared to driving, flying is extraordinarily safe, but why doesn't it feel that way?
- National Highway Traffic Safety Administration, Record-Low Traffic Deaths and Fatality Rates in 2025
- Ian Savage, Northwestern University, Comparing the fatality risks in United States transportation across modes and over time
- National Safety Council, Injury Facts, Deaths by Transportation Mode
- MIT News, Study: Flying keeps getting safer
- Boeing, Statistical Summary of Commercial Jet Airplane Accidents, Worldwide Operations 1959-2024
- University of Michigan News, Flying still safer than driving, even in wake of Sept. 11 hijackings
- University of Michigan News, Roadway deaths up after 9/11 due largely to local driving
- Gerd Gigerenzer, Risk Analysis, Out of the Frying Pan into the Fire: Behavioral Reactions to Terrorist Attacks
- Ola Svenson, Acta Psychologica, Are we all less risky and more skillful than our fellow drivers?
Get the Newsletter
The latest aviation news and stories sent to your inbox.
About the Author

Tim is the owner and lead editor of AeroCorner since 2019, overseeing aviation content covering aircraft, airlines, airports, and the broader aviation industry. Through years of researching, writing, editing, and publishing aviation-focused content, he has developed extensive practical knowledge of commercial aviation and air travel. Based in Asia and a frequent traveler himself, Tim also brings firsthand passenger experience to AeroCorner’s coverage. Outside of publishing, he has also explored aviation firsthand through hands-on flight training in New Zealand.